Following the top findings from Media Inflation Watch (MIW) January to September 2016, as done by Mike Leahy, we have the latest MIW figures.
We have been waiting to see how these would be measured, because there has been a great deal of changes in the past few months: most media owners have moved to a nett rate card, others have increased the commission level to 17% and some have kept the 16.5% structure.
In order to make sure that we compare apples with apples, all historic, current and future rates are reduced to nett of commission. Thankfully, most media owners are responding to the harsh economic conditions, and increases have been modest.
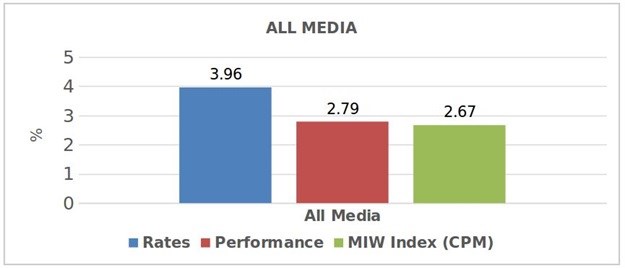
It's good to see that All Media rates only increased by +3.96% overall in 2016 and that the Jan-Sept Index is lower than the same period in 2011, 2013, 2014 and 2015. Because of the overall performance increase (+2.79%) the MIW Index at +2.67% is low and can be attributed to the low TV rate increases.
This is a brief look at the individual media channels...
Television
Although there has been a rebasing of the TV audience (1 AR is now worth 336,430 adults vs 329,180 previously), this hardly contributes to the swell of viewers experienced (ETV and SABC 1 were the major contributors to the surge of viewers – both boasting over 20% up 9 months on 9 months). This influences on the performance and therefore the MIW is a large contributing factor to the lower than usual All Media MIW Index.
Pay TV (DSTV) adjusted its rates, rounding down when moving to nett rates, thus decreasing the total rate, but Mzansi Magic countered this by increasing its rates. However, the overall 1.32% increase in rate is lower than the +7.72% in the first quarter of 2016.
Print
With all print increasing a low +4.89%, one would think that the MIW Index would also be low – but the -7.58% performance pushed the MIW Index to +14.57%. The highest rate increases are coming from communities, although countered by the best performance within the print category. The declining circulation, across most categories of print, is the cause of the double digit MIW Index.
Radio
This is again the category with the highest rate increases, albeit that these are lower than previous periods. The highest rates occur in the Black format stations (+14.98%) because of the SABC’s policy to close the CPM gap between these stations and its independent competitors.
Performance is set at 0% because in January, the BRC RAMS study took over from SAARF RAMS, and the two methodologies are different and therefore data is not comparable. In order for integrity, the Performance Index is set back to 0 and the rate increase is used as the MIW Index. A final CPM will be released once quarter 4 of 2016 has been released.
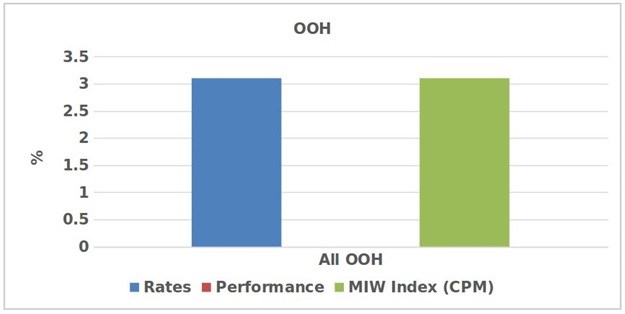
Out of home
This category is once again flat when compared with competing media.
Cinema
This Index is calculated from the top 15 Ster-Kinekor houses (approx 140 screens). Cinemark had a 6% increase in July 2015, with no real increases since then. In Jan-Sept 16, the audience fell slightly when compared to the same period in 2015.
Online
Because all the sites in the schedule have a CPM rate, there is no given change in performance (performance is constant). We must remember that many sites offer large discounts and this must be considered with any evaluation.
It will be interesting to look at MIW Index once again, when the whole of 2016 has been analysed. However – the MIW Index is looking promising in that it is not too high. Marketers often wonder what media costed 10 or 20 years ago. As a fun exercise, we used MIW to go back and look. With 1998 as the anchor year, we can see which mediums increased their rates the most, and in which year.
The graph below demonstrates Media Inflation by medium, only considering full years (and that is why 2016 can only be included once quarter 4 data and therefore the full year is finalised).