Subscribe & Follow
Trending


 New Chinese cars are everywhere – but are they tough?Nicholas Pillay


Jobs
- Research Sales Executive Johannesburg
- Research Intern Johannesburg
Consumer indicators cause for concern
These indicators show first of all how South African consumers are doing in terms of their ability to spend; based on the cost of living (CPI) and the availability of consumer spend based on the number employed individuals. Also important are the percentage increases in wages and the extension of credit to individuals.
The health of the South African consumers translates into GDP growth. GDP indicators give a good indication of the industries being affected by market elements.
Liquidation figures along with the number of new companies being registered are an indicator of the state of the market in terms of competition.
Finally, corporate health indicators of the business confidence index show the gap between the input and selling price and new orders, giving a good indicator as to where companies are feeling the pressure.
Consumer Inflation
The cost of living for South African consumers directly affects their ability to spend their money. Changes in the indicators for July 2011 are:
| Month on Month | |||
| Item | Jun-11 | Jul-11 | Jul-10 |
| Food and non- alcoholic beverages | 7.10% | 7.40% | 1.40% |
| Housing and utilities | 6.80% | 6.90% | 6.40% |
| Transport | 5.20% | 5.30% | 1.10% |
| Restaurants and Hotels | 1.10% | 5.40% | 6.40% |
| Miscellaneous goods and services | 4.40% | 4.20% | 5.80% |
| Year on Year | |||
(The Graph indicates% contribution to inflation) (Source: Stats SA)
These figures show where consumer inflation has increased month-on-month but also year-on-year. Of particular concern is the increase in the cost of food, as this element of CPI affects all South Africans. When analysing which foods have gone up in price, those most affected are meat, fish, oils and fats, milk, cheese, eggs, bread and cereals.
Another figure, which affects all working South Africans, is the increase in the cost of transport year-on-year. This figure is heavily influenced by the cost of fuel and will be influenced by increased road tolling costs.
The increase in the consumer inflation figures in these two key areas will affect the amount of disposable cash the average South African consumer has to spend.
The Job market
The unemployment rate in South Africa was recently pegged at 25.7%. This speaks directly to the ability of consumers to spend. To better understand who is most affected by unemployment rates the following graphs are helpful.
Title: Movement in the job market

This graph shows an improvement in the number of people losing jobs and an improvement in the number of new entrants.
Title: Structure of employment

This graph shows an increase in the number of educated and managerial staff employed and a decrease in employment in the lower segments of the market. The concern with a decrease in employment in the unskilled labour market is poverty alleviation and the potential for people in this sector to find work elsewhere.
Credit extension

The increase in the extension of credit to the private sector and government is a good indicator of the potential cash flow and flexibility this credit extension offers. The extension of credit along with favourable interest rates should assist with the roll-out of projects and purchasing of large capital goods.
In addition, the maintenance of low interest rates which analysts are expecting to continue will assist both private and corporate individuals in effective debt repayment as well as increased availability of cash as their debt will cost less to repay.
Gross Domestic Product
South Africa's GDP grew by just 1.3% in the second quarter of 2011. This figure is down from 4.5% growth for the first quarter of the year. The main areas where quarter on quarter negative growth was seen was manufacturing with a negative 7% growth, mining and quarrying with a negative 4.2% growth and agriculture and fishing a negative 7.8% growth.
When looking at year on year figures however, the unadjusted real GDP at market prices increased by 3% year-on-year, with the mining and quarrying industry increasing by 9,7%, the wholesale, retail and motor trade; catering and accommodation industry increasing by 3.9%. The transport, storage and communication industry increased by 3.7%; general government services increased by 3.4% and finance, real estate and business services increased by 2.8%.
The highest contributors to GDP are represented as follows:

Corporate Health
In looking at how businesses in South Africa are faring, there are three indicators which provide a good snap shot of the market. The first is the number of liquidations.
The liquidation figures between 2005- 2011 as indicated in the graph below.
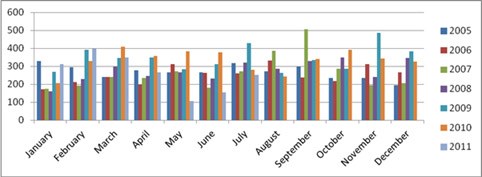
The dip in May in liquidations is viewed as a market anomaly and Coface South Africa is attributing this to the introduction of the Business Rescue Act. The company's experience is a stabilisation of liquidation figures. It has however been seeing cash flow issues with creditors as they trade through tough times with debtors by extending terms rather than liquidating the debtor.
The second is the business confidence index. This gives a good idea of the business sentiment in the country. The following table from the business confidence index give a good snap shot of areas of improvement and decline on a month on month basis and a year on year basis.

The biggest concern in terms of a negative indicator is the utilities indicator as the ability of government to provide the necessary services for positive business growth at a reasonable price affects all business across all industries, and thus could have a far reaching affect.
Trade conditions survey
The final indicator when looking at the business environment is the Trade Conditions Survey which tracks the change in sales volumes, new orders, inventory levels, selling prices and input prices and employment.
The new orders indicator as represented in the graph below shows a sharp decline in the demand for orders in July 2011 compared with July 2010.

In addition to the lack lustre performance with regards to new orders there has also recently been a change in selling price and input prices. This indicator speaks to the margins of companies as they balance input costs with selling price. The graph below shows the evolution of this relationship over the last year:

The increase in input costs is a concern as companies will have to either absorb this increase and reduce margins or pass the increase on to consumers in the cost of products.
In conclusion, there are some positive signs of renewed growth in the market which include increased credit extension, a stabilisation of liquidations, interest rate stabilisation. These growth indicators are however being hampered by increased inflation and the unemployment rate, which is translating into slower growth for corporates as well as margins being squeezed as the corporates work towards balancing the price of goods with what the market is prepared to pay.
About Paul Jooste
Paul Jooste is a senior manager, business portfolio at Coface South Africa.Related