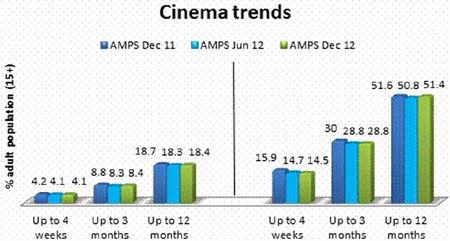
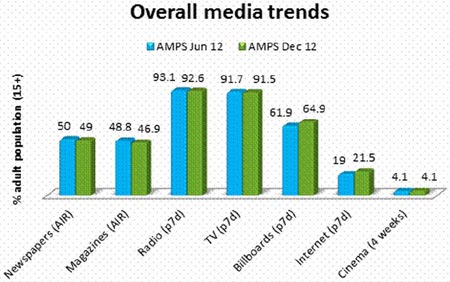
Magazines have posted lower readership levels, causing print in general to trend down. Daily newspapers maintained their readership bases, with weekly publications stable but trending down. As in the previous AMPS release, five of the eight out-of-home formats measured showed significant gains in exposure, with internet consumption rising strongly as usual. Radio, television and cinema consumption remained stable.
All results are based on adults aged 15+. Only statistically significant differences are quoted and are based on percentages, not on number of people. Unless otherwise stated, all comparisons made are between the current release (AMPS Dec 12, January-December 2012) and the previous (AMPS Jun 12, July 2011-June 2012).
No population update has been applied to this release of AMPS.
While an update of population estimates is done on the SAARF products on an annual basis in order to stay abreast of the country's population figures, SAARF decided not to update the current AMPS release in line with the top-line Census 2011 data currently available.
In the interest of stability, SAARF has decided to incorporate the new population data into all SAARF products only once all the census data, including lower level, magisterial district level data, is available. In this way, there will be only one major change as the full set of census data is incorporated.
At the time of the release of AMPS Dec 12, this census data was not available. The old universe figures have therefore been applied, rather than delay the release of this database.
The next population update that will use the detailed census results will be for AMPS Jun 13 (July 2012-June 2013), which will be released in October 2013.
LSMs remained stable, with upward trends at the top of the scale and downward trends at the lower end.
Household income
Household income is showing movements in the right direction. The lowest income bracket - under R799 a month - has contracted, from 3.4% of households, to 2.8%. Average household income is R9,169 a month, up from R8,612 a year ago in AMPS Dec 11. This is an increase of 6.5%, which is ahead of annual inflation at 5.6%.
| AMPS Jun 12 | Amps Dec 12 | |
|---|---|---|
| Up to R799 | 3.4% | 2.8% |
| R800-R1 399 | 10.0% | 9.3% |
| R1 400-R2 499 | 11.4% | 11.9% |
| R2 500-R4 999 | 21.0% | 21.4% |
| R5 000-R7 999 | 16.5% | 16.4% |
| R8 000-R10 999 | 11.9% | 11.8% |
| R11 000-R19 999 | 12.6% | 13.0% |
| R20 000+ | 13.1% | 13.3% |
The work status of South Africa's adult population has remained stable over AMPS Jun 12. Despite an upward trend in the percentage of people working, there has not been a corresponding downward trend in unemployment levels.
Education
The proportion of the South African population with a matric or higher qualification has increased significantly over the previous AMPS, from 43.9% to 46.3%.
There were no significant changes when it came to people's access to services and household durables. Electricity has plateaued at 92.7%, with water in the house or on the plot at 81.4%. Slightly more households have a flush toilet now than previous: 66.2%.
There were no significant changes in terms of household durables.
Print reaches 64.5% of the adult population, with an average issue readership of 22,518-million. While stable on the previous survey, the number of readers in total has declined by just over 400,000, with 15-24-year-olds contributing most to this loss.
Overall, average issue readership for the last three surveys was:
| AMPS Dec 11 | AMPS Jun 12 | AMPS Dec 12 | |
|---|---|---|---|
| Daily newspapers | 30.8% | 30.9% | 30.9% |
| Weekly newspapers | 34.1% | 32.8% | 31.8% |
| Total newspapers | 48.9% | 50.0% | 49.0% |
| Magazines | 50.5% | 48.8% | 46.9% |
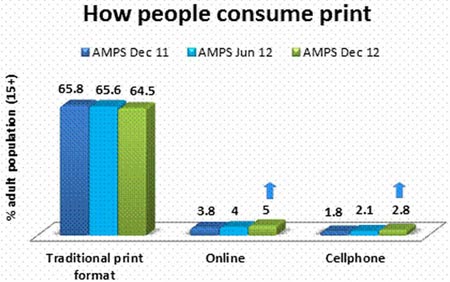
| Total newspapers/magazines | 65.8% | 65.6% | 64.5% |
The slow decline of print repertoire continues. On average, people read 3.85 print titles.
Average number of publications read (based on readers)
| AMPS Dec 11 | AMPS Jun 12 | AMPS Dec 12 | |
|---|---|---|---|
| Total newspapers/magazines | 4.07 | 3.96 | 3.85 |
After trending up in the previous survey, reading on non-paper platforms is now up significantly. Online and cellphone reading both showed significant gains, although their bases are still extremely small: 5% for online reading, and 2.8% for cellphone reading.
People are also not reading digitally to the exclusion of printed formats. Analysis of the figures shows that for the most part, people who are reading print titles online or on their cellphones are also consuming print in its traditional form.
There were few headline-worthy movements in newspaper readership over the previous AMPS release, with the medium holding fast to its readers.
Average issue readership remained firm at 49.0%, giving newspapers a combined audience base of 17,105-million. The medium has, however, lost readership in metro areas; this is true for nearly all individual newspaper titles. Readership in the 15-24 age group is also down on the period before, from 49.4% to 46.9%.
Total newspaper repertoire is trending down, as shown below.
Average number of publications read (based on readers):
| AMPS Dec 11 | AMPS Jun 12 | AMPS Dec 12 | |
|---|---|---|---|
| Daily newspapers | 1.34 | 1.34 | 1.32 |
| Weekly newspapers | 1.70 | 1.71 | 1.72 |
| Total newspapers | 2.10 | 2.08 | 2.06 |
A depressed economy and growing challenges from technologically enabled media platforms have done nothing to suppress the daily press. Daily newspapers have maintained their readership, attracting an almost-unchanged audience over AMPS Jun 12. Average issue readership is 30.9%, with 10,795-million readers. Readership of individual publications remained stable.
Weeklies are showing some decline, albeit nothing statistically significant. Average issue readership is 31.8%, with 11,124-million readers.
Readership is down in Limpopo specifically, from 17.1% to 12.3%, a drop which is caused by the decline of Soccer Laduma in this province. There were periods in 2012 when readership of soccer magazines and newspapers went up markedly in Limpopo. The decline now is most likely simply a return to normal reading levels.
This is the only print sector where repertoire is trending up: from 1.7 titles read per person a year ago, to 1.71 in the previous AMPS and 1.72 currently.
Monthly newspapers
The monthly newspaper sector is down from 3.6% to 2.9%, specifically in Mpumalanga, Limpopo, and the North West, with losses in male readers, the 15-24 age group, and LSM 5-7.
With only two titles in this sector, this decline is due to Vuk'uzenzele's loss of readership, from 3.1% to 2.5%. The publication's negative demographic shifts mirrored those seen for the sector as a whole, with the exception of the loss of 15-24-year-old readers.
Vuk'uzenzele changed its frequency from a bi-monthly magazine to a monthly magazine in the July-December 2011 AMPS questionnaire. In the January-June 2012 questionnaire, the publication changed its format from a monthly magazine to a monthly newspaper. The publication's readership decline is probably due to these changes.
Magazine readership is down significantly from 48.8% to 46.9%, with 16,397-million readers in total. The biggest contributor to this decline was the loss of black readers, who account for two-thirds of the drop. Most of these readers were in LSM 5-7, suggesting that economic factors were the motivation for this move away from magazines.
There was also less readership in small urban and rural areas (where 431,000 readers were lost), in Limpopo, and in the 25-34 age group.
Not only are fewer people reading magazines, but those who are reading also read fewer titles. The average number of publications per reader continues to decrease, from 3.12 in AMPS Jun 12, to 3.07 currently.
Average number of publications read (based on readers):
| AMPS Dec 11 | AMPS Jun 12 | AMPS Dec 12 | |
|---|---|---|---|
| Magazines | 3.21 | 3.12 | 3.07 |
Changes for individual publications family-interest magazines
Men's general magazines
Women's general magazines
Business and news magazines
Home magazines
Motoring magazines
Sport/hobby magazines
Radio
(Please note that SAARF RAMS is the official currency for radio.)
As is the case with RAMS, radio listening as measured by AMPS remains resolutely stable. Total weekly radio listening is pegged at 92.6%. Declines in total radio's Durban-based audience have come from the commercial radio sector, and specifically from Ukhozi FM.
Commercial radio is consumed by 89.8% of the adult population each week (commercial radio being all those stations which are not community radio).
Just over a quarter of all adults (25.1%) listen to community radio (p7d). Audiences have grown in East London as new stations have come on air in that region, but there were declines in Limpopo and in rural areas.
Listening on cellphone and online platforms has increased significantly. Cellphone listening rose from 26.0% previously to 27.7%, while online listening increased from 4.1% to 5.1%, with an additional 350,000 online listeners. Radio listening on the DStv audio channels remains incidental - only 0.5%.
(Please note that SAARF TAMS® is the official currency for television.)
The constant growth of television seen in previous AMPS surveys has levelled out. Viewing remained stable in AMPS Dec 12 across both terrestrial and satellite platforms. The TV universe itself has changed only fractionally, as the incidence of TVs in homes with mains electricity rose by only 4000 new households overall.
The medium has also not gained viewers from digital and cellphone platforms. Traditional TV sets are still the primary access platform for TV, with only 0.8% of people watching TV online, and 1% watching on their cellphones, which is unchanged over the past two surveys.
Total TV viewing is at 91.5% for an average week, equating to 31,978-million viewers aged 15+. While not affecting the overall size of the TV audience, significant downward shifts in SABC1's and SABC2's metro audiences carried through to the medium as a whole, which has a lower proportion of metro viewers than in the previous AMPS release.
Past-7-day viewing for 2012 was:
Out of Home
Out-of-home advertising is a medium accustomed to buoyant AMPS results, and AMPS Dec 12 is no exception. Five out-of-home media types showed significant improvements over the previous AMPS release:
Internet
Also posting stronger consumption figures - and it comes as no surprise - is the internet. The medium posted significantly improved usage figures, gaining users from a wide section of society, from LSM 5 right up to 10.
On an average day, 15.7% of adults go online, up from 13.4% in the previous AMPS release; that's an increase of just over 800,000 users, bringing daily internet audience figures to 5,484-million. Growth came from LSM 5 and up.
Weekly usage rose from 19.0% to 21.5%, or 7,513-million users in total.
Internet usage across four weeks increased from 22.2% in the previous survey to 24.6%, with 8,600-million users.