

Key metrics in app analytics to measure mobile app performance
Some of the metrics that you can base your analysis on are user retention, user acquisition, in-app purchases, app monetisation and many others.
The key metrics and how can they be measured
There are different metrics that can help us measure the performance of the apps on various fronts. The app metrics can be broadly categorised under four points:
Performance metrics
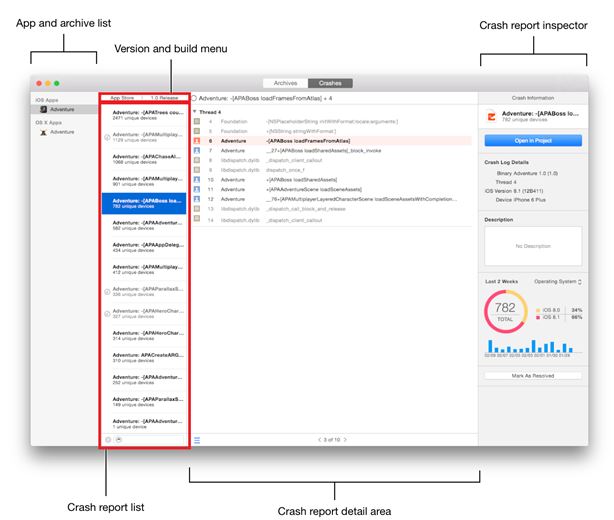
• App Crash: Usually the app crash rate should be 1-2, but can vary depending on factors such as device hardware, compatibility with the software, updates, etc. The app crash report is provided by app stores such as PlayStore and iTunes. This report helps in making modifications in the app to reduce the crash rate.

• Error related to network: Network errors are quite common and show up when the app is not able to connect to the network, thereby resulting in a crash and slow performance. The problem can arise due to bugs in the app or purely due to the a bad network.
• API latency: An app relies on several APIs for fetching data or performing a function. API latency is the turn around time, i.e. the time between the request sent and response received. It must be optimised so that the time does not exceed 1 second.
• App load metrics: Your app can be subjected to varied loads. It must be ensured that its performance does not deteriorate if it is made to work under pressure. This metric helps analyse the performance of the app when the load spikes.
User Metrics
• New users: This metric lets you know how many new users are downloading your app and registering for it. If you have made any changes to the app, this metric lets you assess the impact of the change and whether it is positive or negative.
• Active users: Active users metrics can be divided under monthly active users (MAU) and daily active users (DAU). These metrics need to be tracked to know whether the users are active on the app on a regular basis.
• Total users: This metrics gives an idea about the entire user base. Periodic assessment of the metrics will let you know whether your overall app strategy is working.
• Total downloads: Total downloads shows the number of people downloading the app. It may be compared with the active users to identify the section of the app which is causing the users to bounce off the app.
Engagement and retention metrics
• Session interval: The time gap between the user's session and the next one with the app is called the session interval. It shows the frequency with which the users are interacting with the app. User experience can be optimised based on the reports from this metric.
• Session length: This metric provides an idea about the time an average user is spending on the app per session. It also helps you get an idea whether the users are completing the checkout process in case of an m-commerce app.
• Retention: Using the metric, you can categorise the retention based on the device, marketing campaign and user segment and make improvements in the app.
• Time in app: It is the time that the users spend with the app over a period. This helps you assess the level of engagement of the users with the app. It also gives a clear picture of the user pattern.
• Screen flow: When the users interact with the app, they visit the screens of the app and navigate between them. Screen flow metric tracks these interactions and gives a clear picture of the problem areas of the app that can be rectified accordingly.

Business metrics
• In-app purchases: It is good to offer the app for free on the app stores and rather let the users make in-app purchases. Track the in-app purchase metric to assess whether the in-app purchases offered are exciting enough for the users. Also, use the information to spike up interest in the app to promote in-app purchases.
• App monetisation: This metric needs to be tracked in order to know which app monetisation is working in the best manner for the app and which one is not performing and should be scrapped.
• Goal conversion: The goal conversion metric lets you track each and every short-term and long-term goal and make changes in the app to accomplish them.
• Acquisition cost: Apps are discovered by the users through different channels. You need to analyse which channels are performing well and concentrate on them.
• Transaction abandonment: Transaction abandonment is referred to a case when a transaction is aborted, either by the user, by the merchant or the vendor due to several reasons including app crash and user experience not being up to standard.
• Life time value: Purchasing power of different user segments, loyalty of the user, and mobile vs. non-mobile users are some pieces of information that can be gathered using this metric.
Through utilising and monitoring theses different metrics, you can get better user acquisition and user retention as well as enhanced performance and an increased user-base.


