

Subscribe & Follow
Trending


Suburban teaching methods are failing township children, discouraging teachers: What needs to change
Professor Sigamoney Manicka Naicker


#AfricaMonth


Advertise your job vacancies
Jobs
- Customer Service Johannesburg
- Industrial Property Broker Durban North
- Administrative Operations Coordinator Cape Town
- Freelance Relocation Consultant Cape Town
- Commercial Property Facilities Manager Durban
- Bookkeeper Stellenbosch
- Commercial and Industrial Property Broker Durban
In the news


Housing “bubbles” and “over-exuberant” periods - always a subjective call
Periods of strong housing market price growth can often be a cause for concern. Aspirant first-time buyers fear that they may not be able to afford a home in future should prices continue to rise rapidly, which may also concern governments trying to drive housing for all their citizens. Mortgage lenders could be concerned that an unsustainable situation is mounting, which could later lead to a price “correction” (decline) and negative equity situations where homeowners owe more on their homes than the home is worth (a potential problem for both lender and borrower alike when the homeowner can't easily sell a home and settle his outstanding mortgage debt with the proceeds).
© Hansueli Krapf – 123RF.com
Should there have been widespread financial over-commitment, as a result of a housing boom accompanied by easy credit, the levels of financial stress during the correction can be severe, and a negative equity situation then becomes troublesome for mortgage lenders and their clients alike.
Identifying market bubbles
Identifying housing market bubbles, or market “overshoots”, is always a tough task. Not only have we not yet reached a stage where we can accurately match a specific house price level to the existing economic fundamentals at the time, but the economic fundamentals are constantly changing too.
Even the claim that the pre-2008 boom market underwent a major “overshoot” or, otherwise put, it had moved away from underlying fundamentals, is admittedly always a subjective one. We make such a claim about that period after comparing the national housing market with itself at different periods over time, and concluding that the 2000-2008 boom was extreme in nature by comparison to anything that had happened over the past few decades.
We did not merely take this view after examining house price inflation over the period. Indeed, house price inflation during that time was more extreme than at any stage in SA’s recorded housing market history, measuring a cumulative 304% from the beginning of 2000 to early-2008. But we delved further and also observed:
- Major deterioration in a variety of home affordability measures not seen in recorded history. House prices in real terms, i.e. when adjusting the FNB House Price Index for general inflation as measured by the CPI (Consumer Price Index), rose cumulatively by a massive 144.3% from the start of 2000 to early-2008. The Average House Price/Per Capita Income Ratio Index rose (deteriorated) by 95.2% over the same period;
- House price inflation far outstripped the prime rate percentage at the height of the boom, around 2004/5, creating what can only be termed a speculators’ paradise at the time;
- A sharp surge in high frequency buying and re-selling of homes around that time followed, pointing to such elevated speculative and “over-exuberant” buying and selling behavior;
- There was also a surge in ownership of less essential secondary properties;
- High rates of buy-to-let buying took place around that time;
- Aggressive mortgage lending was a key theme until early-2008 despite key indicators pointing to sharply rising risk in the market, such as affordability deteriorations, sharply rising household indebtedness and a rising debt-service ratio (the best predictor of a rise in mortgage arrears to come), which pointed to “over-exuberance” in the mortgage lending sector too.
The residential market behaviour at that time proved unsustainable, because structurally SA’s economy was not capable of keeping up the 5%+ annual economic growth which we saw briefly just prior to 2008. That economic growth was to a great degree driven by the credit-driven housing and consumer booms, and was destined to slow markedly after the household sector had moved to becoming a highly indebted one. The country has long since moved back to more realistic economic growth rates more in line with its apparent potential growth, recently far nearer to zero.
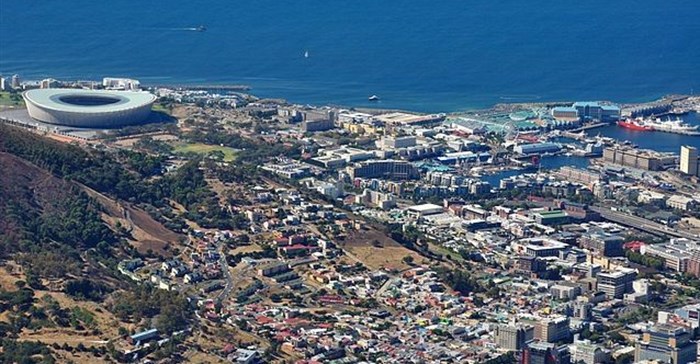
How “healthy” is the Western Cape housing market of late in terms of being aligned to fundamentals?
More recently, some questions have been asked as to the “heat levels” in the Western Cape housing market. Is it a bubble forming, or is it all driven by solid economic fundamentals? Normally, the answer is somewhere in between, with solid fundamentals often starting a good market period, but later on as a result of the fundamentals-driven strength, one can find “over-exuberance” or “buyer panic” setting in as market players respond to the recent price growth trend. This can cause the market to “over-shoot”.
The Western Cape housing market has experienced a relatively good period in recent years, and has seen its house price growth outstrip that of the other major regions in South Africa. Over the past five years, Western Cape cumulative house price inflation has measured 53.7%, significantly more than the next best major region KZN, with 30.2%, Eastern Cape’s 26.6% or Gauteng’s 24.7%.
However, while there has been significant property media coverage of the Western Cape’s recent performance, we do not believe that the province’s market has experienced an “over-exuberant” and “speculative” home buying spree as the whole country, including this region, did prior to 2008.
We make this claim through examining our various indicators of “market psychology” for the region. We find that, at a 10.8% high in the first quarter of 2016, Western Cape average house price inflation did not get more than marginally ahead of the prime rate percentage, thus never in the post-2008/9 period really creating a massive "speculator’s paradise".
No signs of speculative activity
Unsurprisingly, therefore, we don’t see signs of widespread speculative activity in the form of a massive surge in homes resold within a short period after their purchase. As at the second quarter of 2017, we estimate that 4.6% of Western Cape homes resold had been bought within 12 months or less prior to the resale. This is far below the province’s pre-2008 boom time peak of 16.8%, reached in the second quarter of 2005.
We also don’t find signs of mass “over-exuberance” when viewing growth in ownership of secondary properties by local Western Cape residents. The estimated number of secondary homes, expressed as a percentage of total homes, was 14.26% in July 2017, slightly lower than the 14.6% high reached late in 2010. Most recently, in July, growth in estimated secondary homes was at a lowly 0.11% in the region.
Taking secondary homebuying further, the FNB Estate Agent Survey estimates the Western Cape’s percentage of total homebuyers that are buy-to-let buyers at 11.06% for the first two quarters of 2017. This is not extreme, mildly higher than the national average of 9.66% as it has been in recent years, but well-down on last decade’s bubble period 20.5% high for the province around late-2008/early-2009.
Mortgage lending in the province doesn’t appear aggressive either. In the second quarter of 2017, we traced 5,293 bonded property registrations by individuals (“natural persons”) in the Western Cape. This is significantly lower than the 8,134 un-bonded registrations traced in the same quarter, and only 38% of the number recorded in the final quarter of 2004.
And the perception of moderate lending appetite is further supported by one key indicator of lenders’ credit risk appetite, i.e. the average loan-to-purchase price (LTP) ratio. The Western Cape’s ratio has actually declined from 0.90 at the end of 2013 to 0.84 in the second quarter of 2016. Mortgage lenders as a group, therefore, have not tried hard to “keep up” with house price growth in the Western Cape, and this 0.84 LTP ratio is well down on the 0.933 at the start of 2008.
Semigration driving superior performance
So what has driven the Western Cape’s superior housing market performance of recent years? We believe that it has been strong demand from sources outside of the province, including foreigner buying, but more significantly affluent “migrants” from other regions of South Africa.
In the FNB Estate Agent Survey, 2016 saw estimated foreign buying in the Western Cape increase to 8.93% of total buying by the second half of the year (from 6.18% for the 2015/16 summer quarters), widening the gap on the national average foreign buyer percentage which “peaked” at a lower 5.72% in the two winter quarters of last year.
But more impressive was the estimated rise in repeat homebuyers migrating from other parts of South Africa to the Western Cape. In 2016, the “Net Inward Migration” (“Net” referring to those repeat home buyers migrating into the Western Cape minus those migrating outwards to other provinces) of repeat homebuyers rose to an extreme 15.8% of total Western Cape repeat homebuyers. No other province’s net migration rate comes anywhere close. The “migration” is believed to be the result of the Western Cape having built itself a reputation of being a well-governed region, having big economic opportunity, while also having a good perceived lifestyle.
Therefore, the Western Cape’s relatively strong housing market of recent years is very different to the pre-2008 housing bubble. Firstly, the market strength and resultant house price growth of that region has not been anywhere near to the peak growth in the pre-2008 boom period, and the region has to a large degree been made to appear strong by the weakness of other regions. The province’s recent strength does not appear to have been a wildly speculative period, nor does it appear to have been strongly credit-driven. Solid external sources of housing demand appear to have been differentiating the Western Cape from the other provinces of South Africa.
Can the Western Cape’s housing market strength continue? We doubt it
However, there appear to be limits to how far this can go. Key home affordability measures show Western Cape home affordability to have deteriorated more noticeably than other major South African regions.
From 4.35 in 2011, the province’s average house price/per household income ratio has deteriorated (risen) to 5.56 by 2016, which is only mildly lower than the pre-2008 boom time peak of 5.97 in 2005.
This affordability deterioration of recent years was noticeably more than any other province, and the Western Cape’s affordability deterioration appears strongly reflected in first-time buyer and age group buyer estimates for residents of that province. The FNB Estate Agent Survey estimated a lowly 6.64% of total buyers to be first-time buyers in the City of Cape Town in the first half of 2017. This is far below any other major metro region, and far below the national average estimate of 21%.
The next expected event would be for the recent affordability deterioration to begin to weaken demand from the two external sources highlighted, which may just be starting to happen, although it is a bit early to tell for certain.
Healthy slowdown
Already, we have seen some slowing in average house price growth in the province. But, given the apparent absence of a massive credit buying surge in recent years, surges which can lead to financial over-commitment and over-indebtedness in the mortgage market, such a slowdown should be relatively “healthy”, and we need not see a sharp surge in financial stress within the region’s housing market.
To date, such an indication of low financial stress is what we have received from the FNB Estate Agent Survey. The estimated percentage of home sellers selling their homes in order to downscale due to financial pressure was a lowly 7.8% for the Western Cape for the first two quarters of 2017. This is the lowest percentage amongst the major metro regions, and well below the national average of 13%.

Related
Interest-rate cuts hint at a revival in residential construction for 2025 25 Feb 2025 #BizTrends2025: Cautious optimism for better times, but risks are abundant 23 Jan 2025 Coastal Zoom-towns leading business growth 16 Jul 2024 Rainmaker Marketing releases Western Cape Property Market Report 2024 11 Apr 2024