Trending


Elections 2024
Jobs
- Communications Manager George
- Coordinator - Marketing and Communications Johannesburg
- Printing Business Manager Polokwane
- Copywriter Johannesburg
- Copywriter Cape Town
- Account Manager, Producer and Field Producer Parkhurst
- Production Manager Johannesburg
Income figures reveal growth in African households
Household expenditure
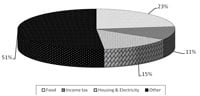
According to Edward Masemola, a researcher at the Bureau of Market Research, Unisa, R1656 billion was spent by households in South Africa during 2009. In percentage terms the distribution of household expenditure was as follows:
- 23 % - food
- 14.7 % - housing and electricity
- 10.7 % - income tax
- 51.6% - assortment of items such as transport, medical and dental services, communication, furniture and household equipment, etc.
The report covers household income and expenditure patterns and trends in South Africa during the period 2008 to 2009.
Selection of findings
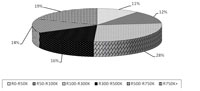
There were 13 654 416 households in South Africa during 2009 and the combined income of R1631 billion in 2009, compared to R1531 billion in 2008, represents 6.5 % growth in household income in nominal terms during the period 2008 to 2009. These estimates are comparable to Reserve Bank estimates. Almost 28 % of these households are found in the middle income group (R100 000-R300 000) - see Figure 1.
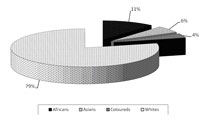
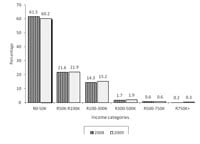
The BMR research shows that 78.9 % of households in the highest income group (R750 000+) belong to the White population group. The African population has, however, shown marked gains with respect to the R750 000 income group. The number of households in this highest income group grew by 26 % during this period - see Figure 2. The percentage of African households in the lowest income group declined from 61.5 % in 2008 to 60.2 % in 2009. This trend is demonstrated in Figure 3 below.
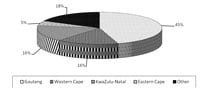
Of all the households in the highest income group, 45.2 % are in the economic hub of the country, namely Gauteng see Figure 4
A disaggregation of household expenditure for Africans and Whites by expenditure group shows that both population groups spent less on transport in 2009 compared to 2008, as evidenced by a negative growth rate of -3.7 % for African households and -5.1 % for White households (in nominal terms) during the period 2008-2009. It is also clear that African household expenditure on recreation, entertainment and sport increased by 18.8 % compared to 16.4 % for White households (in nominal terms) - see Figure 5.
The Research Report, No 395, compiled by ME Masemola (senior researcher), Prof CJ van Aardt (director, Income and Expenditure Research Division) and M Coetzee (senior computer scientist) is available from the Bureau of Market Research.