Trending


Elections 2024
Jobs
- Brand Ambassador White River
- Sales Consultant White River
- Communications Manager George
- Print Machine Minder - Intern Edenvale
- Field Sales Representative White River
- Sales Consultant White River
- Outside Sales Representative White River
- Social Media Manager Cape Town
- Sales Account Executive White River
- Advertising Sales Executive Countrywide
SAARF AMPS June 2013
A new benchmark for media consumption
The inclusion of population estimates modelled on the latest data from Statistics SA's Census 2011 has had a marked effect on this release of AMPS. This will also be the case for RAMS and TAMS, once the population estimates are included in these surveys from November 2013, and from early next year, respectively.
For the past ten years, the annual population estimates applied to SAARF's media audience surveys have been based on the population data from Census 2001.
Since official census data is only available every ten years, population estimates must be made to ensure that SAARF's media currencies stay abreast of population changes in the country. Estimates of actual population levels are modelled by SAARF's demographic contractor, IHS, using sources of data such as birth, death, emigration, immigration, and AIDS infection rates.
Previous population updates were done for AMPS Dec 11 (Jan-Dec 2011), released in March 2012, and reflecting mid-2011 estimates supplied by IHS.
In 2012, however, population levels were not updated, since the results of Census 2011 were imminent. With the recent release of Census 2011 data down to a magisterial district level, SAARF has now incorporated this 2011 population data.
The current release of AMPS Jun 13 reflects mid-2013 population updates, incorporating results from Census 2011, and estimated up to 2013 levels by IHS.
SA's new adult population (15+)
Population figures, updated to 2013 IHS estimates, are:
- 37.214-million, which is an increase of 6.5% over the previous survey (AMPS Dec 12, Jan-Dec 2012), with an additional 2.279-million adults in the market.
- The household population has increased by 6.4% to 14.978-million: an additional 904,000 households.
Overall impact: A new trendline
The inclusion of 2.279-million more adults to the AMPS universe has established a new trend line.
AMPS Jun 2013 sets a new benchmark for all media consumption data, since it is impossible to say with statistical certainty whether changes seen in this AMPS release over previous surveys are due to the large changes in population data, or to actual market forces.
This means that any changes in media consumption may or may not be an indication of shifting performance in the marketplace.
- The upshot is that AMPS Jun 13 CANNOT be compared with any previous AMPS releases.
Impact on a geographical level
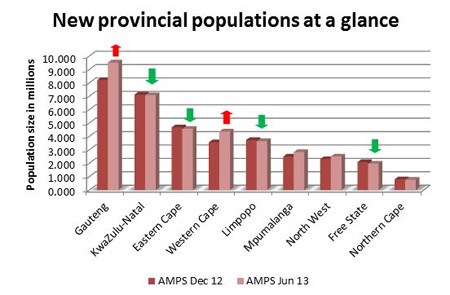
The changes in population have not been uniform across the country. Each province has been affected to a different extent, with a very clear migration taking place to the country's large economic centres.
The top five municipalities - Johannesburg, Cape Town, Durban, Pretoria and Ekurhuleni - now contribute 53.2% of South Africa's economic output.
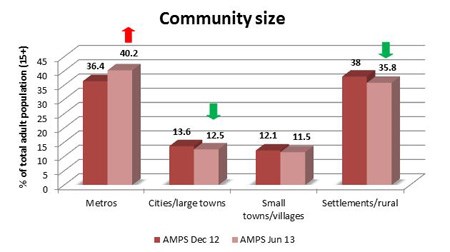
Almost all population increases have been into the metro areas, which are significantly up by over two million. Consequently, the country's proportion of urban/rural has shifted, with the rural component in decline.
The urban: rural split is now 64.2%:35.8%, compared to 62%:38% in AMPS Dec 12.
Gauteng
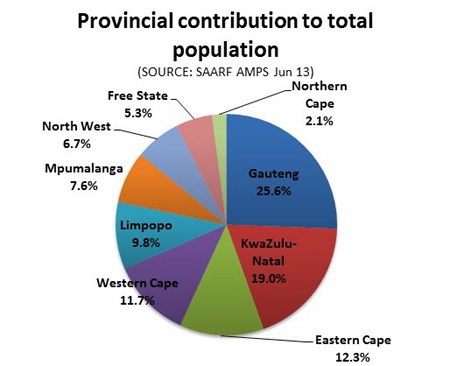
Gauteng has been significantly affected by the population changes, with its population growing by 16%. The province now has a population of 9.516-million, an increase of 1.316-million people over AMPS Dec 12. The province is currently home to 25.6% of the total adult population, up from 23.5% previously.
All metros in the province are showing substantially increased populations:
- Greater Johannesburg, up 451 000 adults to 2.578-million;
- Soweto, up 219,000 people, pushing it over the million mark to 1.023-million;
- Reef, up 527,000 to 3.889-million; and
- Pretoria, up 312,000 to 1.927-million.
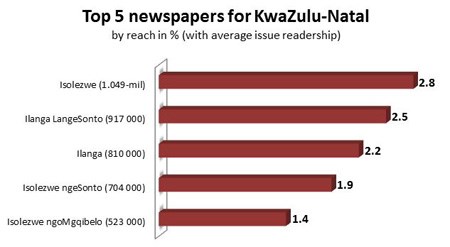
Kwazulu-Natal
This province has experienced a significant decline in terms of its contribution to total population. Gains in other provinces, and a loss of 43,000 adults in KwaZulu-Natal has decreased this province's proportion to 19%, from 20.4% in AMPS Dec 12. KwaZulu-Natal's population is now 7.075-million.
The decline has been in rural areas, with the populations of Durban and Pietermaritzburg remaining comparable to the levels of the previous survey.
Eastern Cape
South Africa's third-biggest province now contributes significantly less to overall population, with its proportion dropping from 13.4% to 12.3%. A loss of 107,000 adults takes its population to 4.565-million. As in other provinces, losses were seen in non-metro areas, with Port Elizabeth and new metropole Uitenhage holding their own.
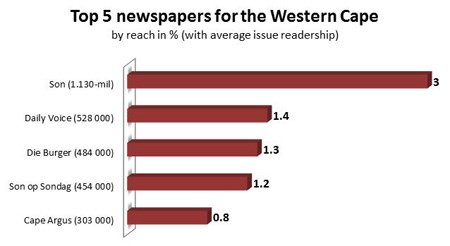
Western Cape
The Western Cape's population grew by 22.8%, with an additional 809,000 people added to the pot. The total population is 4.365-million, representing 11.7% of the total population (up from 10.2%). Of this 809,000 growth, about half was due to a real increase in population, and half to coverage changes.
Previous surveys have sampled 98.5% of the total adult population, excluding a tiny percentage of minority sub-populations which couldn't be identified for sampling in specific areas. For example, since the distribution of blacks outside of Cape Town was sparse, it was not possible to identify a specific area to sample for this group.
If during fieldwork, black people outside of Cape Town were picked up, they were interviewed and given the weight for blacks in that area, but wouldn't be upweighted to represent the whole of the Western Cape.
The AMPS sample has now been expanded, primarily in the Western Cape but to a less-noticeable extent in all other provinces, giving AMPS 100% coverage of the adult population.
Media with a Western Cape focus should bear this in mind when looking at their data; coverage of Cape Town remains the same, but outside of the metropole, the universe expansion will be evident in the data.
Limpopo
Has experienced a significant decline, with a loss of 78,000 adults reducing its overall proportion to 9.8%, from 10.7% previously. Its population is now 3.646-million. Mining issues are likely to have been a causative factor.
Mpumalanga
Gained 336,000 adults. Its population is 2.824-million, or 7.6% of total.
North West
Has gained 192,000 adults, taking its population to 2.496-million. It now contributes 6.7% of the total population.
Free State
Down from 5.9% to 5.3% of the total population, with a loss of 114,000 adults. Metros held their own while rural areas declined. The provincial population is 1.964-million.
Northern Cape
Experienced a slight decrease of 32,000 adults, with a stable population proportion of 2.1%, or 764,000.
Impact on the age profile
The distribution of adults by age has changed significantly.
There has been a large decline in the total number of 15-24-year-olds - 263,000 down - which, coming out of the growth of the population as a whole, means this group has declined in actual numbers, rather than just proportionally. This age group represents 25.7% of the total population, down from 28.1% in the previous survey.
The 25-34 age group has shown significant growth, upping its proportion by 9.7% to 24.8% of all adults. This group saw an additional 1.337-million join its ranks. Immigration is a large factor here.
Despite a rise of 300,000 in number, the 35-49 age group declined by 2.8% proportionally, from 25.2% in AMPS Dec 12 to 24.5% currently.
The 50+ age group grew its numbers by 904,000, increasing its proportion of the total population from 24.0% in the previous survey, to 25.0% currently. This increase in the 50+ demographic has not come through from any one population group, but from all population groups.

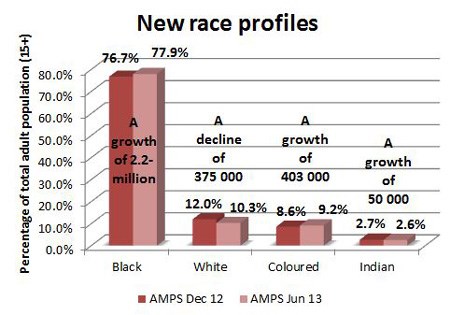
Impact on the race profile
The black population has been the biggest beneficiary of the 2.279-million rise in population. There are 2.2-million more black adults in the AMPS universe, taking this group up to 28.985-million, or 77.9% of total (over the previous survey's 76.7%).
The white population is down by 375,000, to 3.833-million. It now represents 10.3% of the total population, compared to 12.0% previously.
The Coloured population has kept pace with previous levels (rising from 8.6% to 9.2%), with a gain of 403,000 people, taking it up to 3.410-million.
The Indian population has remained proportionally stable (2.6%), despite a growth of 50,000 in total. This group's total is now 986,000.
Impact on LSMs
While the current LSMs are not comparable either in thousands or in percentages to previous AMPS releases, at a top level the quotas remain very similar to those seen in AMPS Dec 12.

Impact on household income
While the current LSMs are not comparable either in thousands or in percentages to previous AMPS releases, at a top level the quotas remain very similar to those seen in AMPS Dec 12.

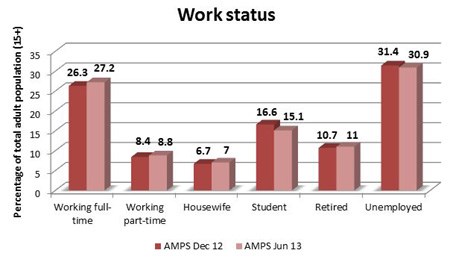
Impact on work status
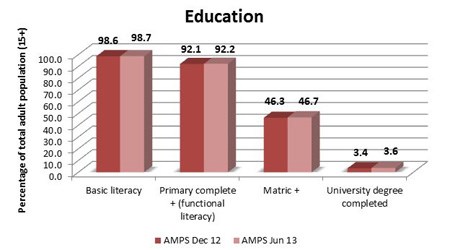
Impact on education
Media audience results
As stated earlier, AMPS Jun 2013 sets a new benchmark for all media consumption data, since it is impossible to say with statistical certainty whether changes seen in this AMPS release over previous surveys are due to the large changes in population data, or to actual market forces.
AMPS Jun 2013, therefore, marks the beginning of a new "reality".
Media data cannot be compared to previous surveys. Changes seen are not necessarily true increases or decreases, but rather a re-adjustment, giving the market a better estimate of reality based on the latest population information.
The effects of the population changes cannot be unpacked from the current figures by removing additional audience groups, or adjusting declined demographics upwards.
Media inflation calculations are therefore also invalid, since it is statistically unsound to make comparisons with previous AMPS releases.
Total print
Average issue readership of any AMPS newspaper/magazine is 63.6%, with a total adult audience of 23.684-million.
Print owners are advised to look at the data underpinning their topline readership figures to get a better understanding of what might have happened to these figures.
For example, Drum's readership is 284,000 stronger after the population update, while Bona's is down by 162,000.
On closer inspection of the two titles' readership profiles, however, one would see that while Drum has a third of its readers in Gauteng, which experienced a massive boost in its population, Bona only has a quarter of its readers from this province. Bona has more readers in the Eastern Cape, Free State and KwaZulu-Natal, all three of which lost population.
Reading platforms
Over and above reading of traditional paper products, 6.5% of adults read a newspaper or magazine online, while 4.1% consume print via a cellphone.
Repertoire
The average number of print publications read, based on readers, is 3.86.
Newspapers
Average issue readership for any AMPS newspaper is 17.674-million, or 47.5% of the adult population.
Daily newspapers
Average issue readership of any daily is 29.4%, or 10.936-million. The average number of daily AMPS newspaper publications read, based on readers, is 1.31.
Weekly newspapers
The new benchmark penetration for weeklies is 31.8%, or 11.830-million readers. The average number of weekly AMPS newspaper publications read, based on readers, is 1.70.
Monthly newspapers
This sector's new benchmark readership is 2.7%, or 995 000 readers.
Effect of regionalisation on newspapers
While the inclusion of the new population data has not caused large penetration changes on a general publication level, the move to regionalise newspaper titles has had a noticeable impact on a number of regional publications.
From AMPS Jun 13, all newspapers are only analysed in their distribution areas, which were provided to SAARF by the newspaper owners.
When readership is picked up outside of the publication's official area of distribution, this readership has been removed from the AMPS database, since owners of regional newspapers agreed that this readership is not of value to advertisers.

- Top newspaper title in the Eastern Cape: Daily Dispatch, 0.6% reach, 224 000 readers.
- Top newspaper title in the Free State/Northern Cape: Volksblad, 0.3% reach, 126 000 readers.
Magazines
Magazine penetration has held its own against the new population update - if it were possible to compare current figures with the previous survey, few statistically significant changes would be seen.
The new benchmark for total magazine readership is 46.8%, or 17.403-million readers. The new benchmark average issue readerships for the various magazine formats are:
- Any weekly magazine: 24.4% readership, 9.080-million readers.
- Any fortnightly magazine: 3.9% readership, 1.436-million readers.
- Any monthly magazine: 36.7% readership, 13.674-million readers.
- Any alternate-monthly magazine: 4.8% readership, 1.800-million.
- Any quarterly magazine: 2.0% readership, 732,000 readers.
The average number of AMPS magazines read, based on readers, is 3.09.
First readership figures
- Grazia's first 12-month measure is 63,000, or 0.2% penetration into the adult (15+) market. The title's audience is 78.1% female, 40.6% are aged 25-34, 29.9% are aged 15-24, and 68.7% are in LSM 8-10.
- Good Housekeeping first 12-month readership figure is 137,000, or 0.4% reach. The publication's readers are majority female (82.7%), aged 50+ (31.1%), and in LSM 8-10 (59.3%).
- Top Gear has started with a bang, achieving a 12-month readership of 731,000, or 2.0% readership. The majority of readers are male (81.5%), aged 15-24 (42.6%), and 54.4% are in LSM 8-10.

Television
(Please note that SAARF TAMS® is the official currency for television.)
The new benchmark figure for television viewing is 91.6%, with 34.095-million viewers. The new benchmarks for individual television platforms (7 days) are, in order of size:
1. SABC 1: is viewed by 79.3% of the total adult population, amounting to 29.521-million viewers.
2. SABC 2: 71.2% viewership, 26.479-million viewers.
3. e.tv: 66.7%, viewed by 24.836-million adults.
4. SABC 3: 56.6% viewership, 21.062-million viewers.
5. Total DStv: reaching 31.4% of adults (11.669-million).
6. Total community TV: 10.0% viewership, 3.738-million viewers. Soweto TV commands 9% of viewing, showing its dominance in the community TV sector.
7. M-Net main channel: 6.9%, 2.560-million.
Radio
(Please note that SAARF RAMS® is the official currency for radio.)
The new benchmark for radio listenership is 34.257-million listeners per week, with a reach of 92.1%.
- Total commercial radio: 33.272-million listeners, with a reach of 89.4% (past 7 days); and
- Total community radio: 9.375-million listeners, with a reach of 25.2% (past 7 days).
Radio listening platforms
On top of listening on traditional devices, 29.5% of adults listen to radio on their cellphones, 5.8% listen online, and 0.5% listen on DStv's audio channels.
Out of home
(All formats mentioned are those which carry advertising.)
In addition to the population update making comparison with previous AMPS releases impossible, this media sector has also completely changed its questionnaire methodology as of AMPS Jun 13.
For both these reasons, comparisons with previous AMPS data are invalid.

Internet
- Access internet yesterday: 6.922-million users, 18.6% of the total adult population.
- Access internet in the past 7 days: 9.035-million users, 24.3%
- Access internet in the past 4 weeks: 10.182-million users, 27.4%

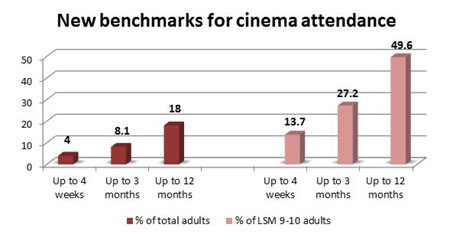
Cinema
- Cinema up to 7 days: 415,000 people attended a screening, 1.1% of total adults
- Cinema up to 4 weeks: 1.475-million people attended, 4.0% of total adults