Trending


 Sabre EMEA 2024 Awards: Razor PR, Retroviral top SA agenciesDanette Breitenbach
Elections 2024
Stats SA's confusing mining employment statistics
The GroundUp article How employment has changed in 10 years used data from Stats SA’s Quarterly Labour Force Survey (QLFS) for the table and graph. The QLFS is the most reliable source of employment statistics, but it has a serious flaw: its mining employment data is wrong. It states that the number of mining jobs rose 13% between the first quarters of 2008 and 2018, from 353,000 to 397,000.
In fact, more accurate data, for mining only, is available in the Quarterly Employment Statistics (QES). This paints a very different (and glummer) picture. It reports a 13% drop over the same period, from 519,000 to 454,000 jobs.
There are many methodological differences between the QLFS and the QES summarised in the table below taken from Stats SA.

Generally the QLFS is superior to the QES. The latter obtains most of its data from a survey of 20,000 non-agricultural businesses. But its mining data is obtained from the Department of Mineral Resources which every month surveys every operating formal-sector mine in the country.
The QLFS mining employment data, for various reasons including difficulties counting mineworkers living in hostels, has historically been very inaccurate.
It has improved since a change in methodology in 2015.
Up until that improvement this note used to appear in the QLFS:
Mining is a very clustered industry, hence the industry might not have been adequately captured by the QLFS sample. For more robust mining estimates, please use the Quarterly Employment Statistics (QES).
The graph below shows mining employment from 1993 to 2017. The Labour Force Survey (LFS) preceded the Quarterly Labour Force Survey. Sources: DMR data, Stats SA for LFS and QLFS.
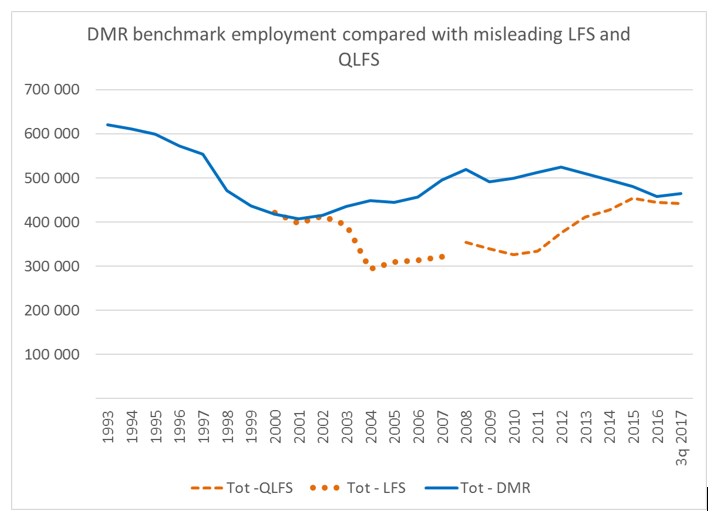
We used to include this note in the QLFS report until Quarter 1 2016: “Mining is a very clustered industry, hence the industry might not have been adequately captured by the QLFS sample. For more robust mining estimates, please use the Quarterly Employment Statistics (QES)”.
This was purely because the 2007 Master Sample that was used to draw the sample for the QLFS did not have a mining stratum. The 2013 Master Sample that has been in use since Quarter 1 2015 has a Mining stratum within metros/non-metros which was defined for Primary Sampling Units (PSUs) with 30% or more employment in the mining industry. If it was not for quarter-to-quarter and year-on-year comparisons in estimates, the note on mining in the QLFS report would have been removed from Quarter 1 2015. The Quarter 1 2015 estimates (from 2013 Master Sample) were compared to Q4 2014 estimates (from 2007 Master Sample) and Quarter 1 2014, hence the note was kept in the report. The last QLFS report with estimates compared to those based on the 2007 Master Sample was the Quarter 1 2016 report. Since Quarter 2 2016, the note has been removed from the QLFS report given that all the data points in the report were based on the 2013 Master Sample.
So, the mining estimates from the QLFS should be close to those produced by the QES. In the 3rd quarter (Jul-Sep) of 2018, QLFS reported 406,000 people employed in Mining and the QES reported 457,000. What is important is that the patterns observed over time for the two survey are the same.
The key differences between the two surveys are presented in both QLFS and QES quarterly reports. The two surveys are complementary and not in competition, so users decide which survey estimates they use.Source: GroundUp

GroundUp is a community news organisation that focuses on social justice stories in vulnerable communities. We want our stories to make a difference.
Go to: http://www.groundup.org.za/Related